
Park 64 Capital Blog
Thanks for stopping by and checking out our blog. We post interesting things about finance that we think are of use to the general public, but you should never interpret anything on our website to be financial advice.
How Professional Investors Create Portfolios of Undervalued Stocks
What is the basic strategy for building portfolios of undervalued stocks?
Some of the greatest investors of our time have been known to find stocks at a bargain to generate large returns over time: Warren Buffett, Phil Fisher, and John Templeton come to mind. While the task is by no means easy, creating a portfolio of undervalued stocks can be a good way to potentially earn higher returns, as undervalued stocks may be priced lower than their intrinsic value and have the potential to increase in value as the market recognizes their true worth. However, finding undervalued stocks can be challenging because it requires requires careful analysis, the right tools, and patience. In addition, investments sometimes don’t pan out like people think, and it’s easy to fall into value traps (thinking there is value where there really isn’t).
Here are some steps you can follow to create a portfolio of undervalued stocks:
Research companies: Start by researching companies that you are interested in investing in. Look for companies with strong financials, such as consistent revenue growth, a healthy balance sheet, and a track record of profitability. John Templeton always said that you should focus on the future of a company, not just what it’s doing in this very moment.
Analyze financial statements: Look at the company's financial statements, including its income statement, balance sheet, and cash flow statement, to get a better understanding of its financial health and performance. Look for red flags, such as declining revenues or increasing debt, that could indicate that the company is not performing well. For most investors, financial statements are a barrier to entry because it requires some proficiency in accounting to understand.
Compare the stock's price to its intrinsic value: Use financial ratios, such as the price-to-earnings ratio (P/E) or the price-to-book ratio (P/B), to determine if the stock is undervalued. If the stock's price is lower than its intrinsic value, it may be considered undervalued. However, keep in mind that earnings can be calculated in a variety of ways, so you can’t just use one method and call it a day. Cash flow is just as, if not more, important.
Consider the company's industry and macroeconomic conditions: Consider the company's industry and the broader economic conditions. A company may be undervalued due to temporary setbacks or challenges that are specific to its industry, rather than due to fundamental problems with the company itself. Betting on the macro environment has proved all but impossible, and many businesses are phased out over time; this is particularly true of the tech sector. Thus, it’s important to consider monetary policy, fiscal policy, and secular trends when choosing your investments.
Diversify your portfolio: It’s not enough to know one specific industry. It's important to diversify your portfolio to spread risk across different types of assets and industries. Consider including a mix of undervalued stocks, as well as other types of investments, such as bonds, real estate, and cash.
Remember that investing carries risk, and it's important to carefully consider your risk tolerance and investment goals before making any investment decisions. It's always a good idea to seek the advice of a financial professional before making any investment decisions. At Park 64 Capital, we set up portfolios with strong fundamentals to help investors reach their long-term goals.
Kelly Betting: How Much to Invest in a Stock
The Kelly Bet Criterion describes a mathematical technique to allocate your investments optimally.
Sizing stock market positions is a difficult challenge. It’s arguably the hardest thing an investor has to do after selecting the investment itself. You might be surprised to learn that there is a theoretical way to optimize an investment allocation, called the Kelly Betting Criterion. The Kelly Betting Criterion was created by a brilliant scientist in mid 20th century named John Kelly. Despite it’s convincing proof, Kelly Betting has some limitations and therefore other considerations must be made when sizing up stock allocations. Let’s dig into the how and why behind this neat little formula.
What is a Kelly Bet?
A Kelly Bet is a mathematical formula used to size investments for the most optimal growth rates as the number of investments approaches infinity. This growth rate is a function of the fraction of wealth invested, the probability of winning, and the odds at stake. For example, consider a wager with a 2:1 payout where you win 60% of the time. Your expected gain on a wager requiring $10 to enter is $8 (2 x $10 x 60% - 1 x $10 x 40%). A casino would never offer this game to you because they’d lose $8 each time on average. That’s easy to understand, but what’s harder to determine is how much of your life savings you’d put into this same wager if you could repeat it ad nauseum.
You know the above wager has positive expected value, but you also know you’ll lose some of the time. For example, if you bet your entire life savings on a single wager and lose, you go broke. Similarly, too small of a bet is counterproductive to making wealth fast enough; this is would be similar to holding most of your wealth in cash.
Now let’s consider an investment with the same wager as described above but under the assumption you have a $1M total portfolio. How much should you invest of that $1M to grow your portfolio optimally? We solve this using the following equation:
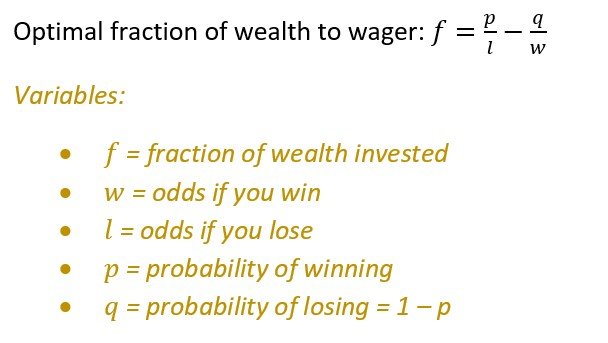
Plugging in the numbers from our example, we can see that betting $400,000, or 40% of our wealth, is the solution. In other words, f = 0.60 / 1 - 0.40 / 2 = .40 = 40%.
The growth rates over the possible range of wealth percentage wagers is shown graphically below. Interestingly enough, there is an inflection point at 75%, where wagering that amount or higher gives you a negative growth rate (this is true despite having a positive expected value of $0.80/dollar, as mentioned earlier. You can also see that wagering 100% of your wealth on a single investment leads to a growth rate of -100%; this should make sense. Even if you’re right about the first 100 investments, it only takes one to ruin you in this particular case.
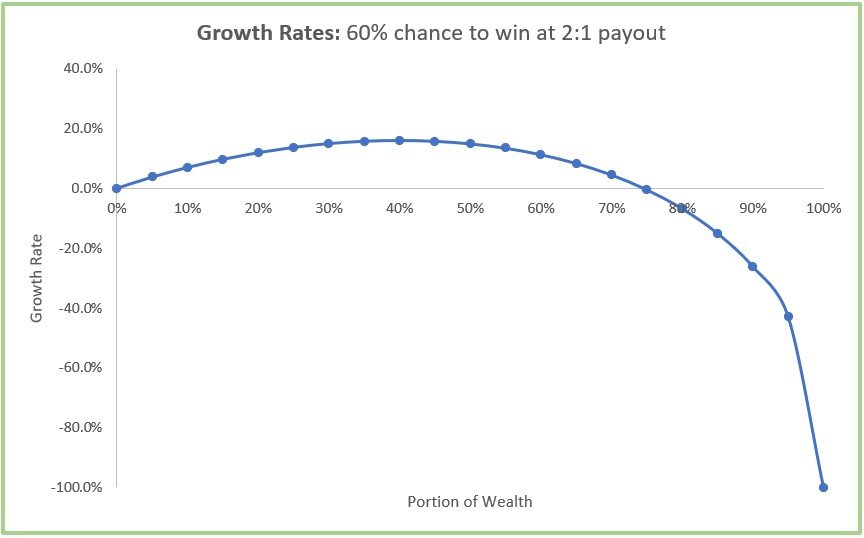
The Kelly Criterion has meaningful consequences as it relates to investment. Notably, even if we think we have an investment with a 2:1 payout and a 60% chance of winning, we still can’t safely bet the farm on it because it’s not the most optimal way to grow our portfolio. We also know that we have to diversify because it’s suboptimal to excessively allocate to a single position.
Why the Kelly Bet Might Not Even Matter
I would contend that the Kelly Betting Criterion is a useful tool to humble one’s confidence and codify the need for diversification (which is typically justified using Modern Portfolio Theory). However, the Kelly Betting Criterion does have a number of limitations that prevent it from being used with any sort of nontrivial level of precision:
There’s no way to know the numerical probability of winning with an investment. The best one can do is thoroughly research to make a yes or no decision.
Investing odds aren’t clear. For the most part, quality stocks don’t go to zero nor can they grow forever. There are discounted cash flow methods I use to create upside vs. downside levels, but there are still a great number of uncertainties in investment that make it impossible to know if something is 4:2 or 4:1.25, for example; the difference would change an allocation meaningfully.
Kelly Betting assumes infinite repeats of a bet; in reality, an investor has a more limited time frame to grow their wealth.
Allocation is tricky because it remains an area of art, science, and experience.; the Kelly Bet criterion is just one tool in the toolbox of understanding. Allocation also requires confidence, humility, and discipline. Investments need to be scaled in proportion to goals, timelines, confidence, risk capacity, and a host of other factors. ETFs can be held in greater proportions than stocks, of course, but it behooves the investor to know the components held in the ETF to ensure the underlying securities are of proper ilk to meet the desired growth rate objectives.
If you’re interested, I’ve included a proof of the Kelly Bet below. It does require elementary calculus to understand fully.

Why Stock Prices Go Up and How to Make Great Investments
This post explains why stock prices change and how to be a great investor.
People as a whole are poor capital allocators. Being a cutting-edge neurosurgeon, a brilliant CPA, or a savvy programmer does not provide the skillset required to be long-term successful in markets. What does then? Before we dig into that, we need to first understand why stocks go up in the first place. On the surface, this feels like an extremely complicated question, and you may even be wondering if I’m trying to trick you. No tricks today. The answer is surprisingly simple:
Stock prices go up when there are more buyers than sellers.
Stock prices go down when there are more sellers than buyers.
Valuation, growth prospects, profitability, and the macro environment are nothing more than signals to bring buyers and sellers to the market. Ostensibly, not all signals are corresponded to rationally; for example, a fantastic earnings report may result in a stock price decline. Why would people sell off a company who posted strong results?! It might surprise you to know that stocks trade based on what is expected to happen in the future, so the alignment of earnings against expectations is what ultimately matters. When future expectations are used as the yardstick for pegging stock prices, short-term volatility is a corollary.
If you knew which days buyers were going to outnumber sellers, you’d have found the holy grail to stock market investing; you’d make money on every trade! It suffices to say that many have tried to build analytical models and systems to predict market direction. Unfortunately, those systems tend to work until they don’t. There are too many variables involved, including emotions themselves, that incentivize people to buy and sell securities. Market prediction mechanisms are more apt to lull an investor into a false sense of security than create meaningful and consistent profits.
The randomness of stock price movements is referred to as Brownian motion. The classic example of Brownian motion is dropping a single bead of food coloring into water and trying to predict where it will go. Hot and cold water, much like the macro environment, will impact the rate of movement, but the actual movement is inherently random.

Brownian motion at work
If markets are indeed random, what odds does that leave for an investor who is trying to build a retirement portfolio? If, after all, stock trading is nothing more than spinning a roulette wheel each day, why not build your retirement at the casino? The truth of the matter is that all short-term movements in the stock market are random, but long-term movements, while still having many unknowns, are much more predictable if you know how to do the proper analysis. Analysis is complex, imperfect, and can be summarized as the act of increasing sets of known information while reducing sets of unknown information until a conclusion regarding an investment can be reached.
Earlier, I mentioned that most people are not successful in making money in markets over the long-term. This is because most people are either traders or other ill-equipped investors. Let’s take a quick look at the difference between a trader and an investor to better understand why.
Trading vs. Investing
These two words get mixed up a lot and in most situations, they can be used interchangeably without any need for correction. But it’s important to differentiate trading from investing for the intents and purposes of this entry.
Trading: Placing a bet on a stock
Investing: Placing a well-educated bet on a stock
Notably though, not all investments are long-term and not all trades are short-term. A trader is making a decision based on emotions, prior price movements, or an idea that lacks sound qualitative and/or quantitative fundamental reasoning. A key difference in investment is the research of various imperatives to determine that there is a substantial chance for material gain relative to material loss; I like to call this differential the asymmetric upside of an opportunity. Proper research also provides the right framework to make better decisions as more information becomes available over time. While even the best investors are occasionally wrong, the successful ones are good not only at making money but also at not losing it. Furthermore, an investor can tolerate a position moving against them for a very long time, assuming the underlying reason for investment has not changed and another more appealing, alternative opportunity has not come onto the scene.
Think of the difference between trading and investing like the difference between Blackjack (trading) and Poker (investing).

In Blackjack, you start every hand with zero information and are simply wagering what you think you can afford to lose; the odds are stacked against you. The dealer will even help you make better decisions, and the drinks may soon become free. Just like your stock broker who wants to keep you trading, the casino wants to keep you playing. Any short-term success will eventually succumb to the inevitability of probable losses if you stick around for long enough. The bid-ask spreads also rack up in trading, a common complaint among those who advocate against selling order flow.
In Poker, on the other hand, each hand brings a series of knowns and unknowns, and you can immediately fold your hand at minimal investment. There are an incredible amount of datapoints that emerge throughout each hand: cards, player styles, bluffs, probabilities, bet sizes, etc. This puts you in the driver seat, allowing you to make bigger bets when the odds are in your favor; and perhaps more importantly, to cut your losses when the status quo becomes unfavorable. And no matter how good you are at Poker or investment, you may still lose even when the odds to win are heavily in your favor, something Poker players call a bad beat.
There are still two grey areas in the differentiation of a trader and an investor:
Time: If a trader holds a poorly researched position for years, are they an investor by fiat?
Sufficiency: How much information must one have to support a position to be considered an investor vs a gambler?
The nuance begged by the above two questions probably doesn’t even matter; those who hold poorly researched positions, even over a long time horizon, are going to make more human judgment errors, resulting in suboptimal asset accumulation over extended periods of time.
How to Be a Successful Investor
Being an above-board investor is incredibly difficult because it requires a massive time commitment to do things that most would consider extremely boring. As mentioned earlier, an investment skillset is very similar to that of a Poker player: long hours of grinding away until the right opportunity strikes; then, careful movement in and out of it. When done this way, long-term stock market success becomes much more predictable; of course, short-term movements are still random, and no market participant wins every single time; therefore, the investor is burdened with sizing his positions accordingly.
The skills to be a superb investor are difficult to define, but here are some of the more basic requirements:
Know the goals of your portfolio. You can’t allocate if you don’t know what you’re targeting.
Look for ideas everywhere. Every 100 ideas probably only has 1 or 2 good leads.
Read the stock’s respective SEC 10-K and 10-Q and have a fundamental understanding of income statement, balance sheets, and cash flows analysis.
New information can’t be ignored. Risk/return trade-offs can change in an instant.
Having exit criteria going in is important; otherwise, how do you know when to increase your bet or cut your losses?
Know how to size your bets. I’ll post another article on this later, but this is a major differentiator between good and bad investors. It’s more mathematical than you might think!
Leveraging an experienced and talented investment advisor can give you instant access to a propitious long-term portfolio without having to commit time and energy to learning a skillset that takes years of careful study to develop with no guarantee of having the knack for it. Pairing with an advisor is one of the best ways to make the most of your career earnings. Unfortunately, most people tend to delay the process until later in life, which subsequently delays their retirement goals.
Your Economics Teacher Gaslighted You, and Why Inflation Keeps Increasing
Inflation is red hot. This is why.
October 2022 - The U.S. economy is in a recession: two consecutive quarters of declining GDP are all that is required.

In a recession, we typically see a decline in interest rates and inflation rates. Ironically, we are seeing the exact opposite:
August 2022, inflation: 8.30%, from 1.30% two years ago
September 2022, 30-year mortgage: 7.00%, from 3.00% two years ago
September 2022, 10-year treasury: 3.80%, from 0.75% two years ago
If you’re confused about why America and the rest of the world is in such a flux right now, you’re not alone. We can’t merely blame Covid, Russia, or China either. While there is some part to be played by globally impactful events, there is another key reason that America seems to be flipped over on her head.

Inflation as of August 2022
How the Economy Works: 101
The economy cycles from expansion to contraction. Think of this like state changes over time that range from very good to very bad. Not all expansions are exuberant and not all contractions are painful. The year 2022 is one of those notable contractions that is very painful.

During expansion:
During expansion, things are great! You don’t hear many complaints from your neighbor, and everyone seems to be winning on all fronts: employment is high, housing markets are extremely competitive, stock markets seem to give free money, and startups grow like weeds.
Generally speaking, in expansionary economies:
Businesses grow - because there is money for the taking
Interest rates rise - because corporations are demanding more investment dollars
Jobs are created - because corporations need more labor
Spending rises - because people have more money
Inflation rises - because demand for goods and services increases
During contraction:
We all know that people tend to go too far and then overcorrect, so it goes without saying that all expansions come to an end in some fashion. During a contraction, consumer spending growth slows and consumer savings start to rise as interest rates become more attractive. As a corollary, production falters as demand for products declines.
Contractions are easy to spot — when you start to hear stories on the news about people losing their jobs and not being able to buy their kids tons of Christmas presents, you’re in a contraction.
Generally speaking, in contractionary economies:
Businesses decline- because there aren’t enough additional profits to justify expenditures
Interest rates fall - because corporations aren’t demanding dollars to grow
Jobs are lost - because companies don’t need the extra labor anymore
Spending declines - because people have less money
Inflation falls - because demand for goods and services decreases
Why interest rates fall during contraction:
In a free market economy, interest rates should fall when corporations are becoming more hesitant to borrow (i.e. sell bonds) due to a glut of either inventory or labor or both. As a corporation’s desire to borrow decreases, so does the interest rate they’re willing to pay to do so. This interest rate lowering affect usually begins at the peak of an expansionary period and signals a contraction on the horizon.
Did Your Economics Teacher Gaslight You?
While we can say that America is in a recession from a technical definition, does it really feel that way? There is only a slight increase in unemployment (left graph below) and the number of workers is still growing (right graph below). We are starting to see some layoffs and hiring freezes, notably at certain big tech firms such as Facebook; yet, decent jobs can still be found with reasonable effort.

According to theory, a contracting economy brings job losses, declines in spending, declines in interest rates, and declines in inflation. But as of October 2022, we’re seeing increasing interest and inflation rates paired with a stalled out, or arguably declining, economy.
So is economic theory just a pack of lies your former teacher told you to sound smart, or is there any hint of truth to it? To understand why increasing interest and inflation rates can coexist in a stagnant economy, let’s take a hard look at the most powerful market manipulator of the 21st century: the Federal Reserve Board.
The Federal Reserve Board is Killing Your 401(k)
From 2008-2021, the Federal Reserve Board (the FED) has been working in conjunction with the United States Treasury to increase the money supply, a process called quantitative easing (QE). During QE, the Federal Reserve Board purchases government bonds from banks. This has a stimulatory effect on the economy because it increases the banks’ reserves and therefore makes it easier for those banks to lend at more favorable terms, resulting in the growth and expansion of American businesses. While QE is useful to stimulate an otherwise declining or stagnant economy, it is a powerful tool that flies in the face of a free market economy.

Money supply in America
During QE:
The FED is lending to the economy - this is stimulatory
Stock prices rise - because businesses can grow so much more when money is cheap
Bond prices rise - because the FED adds to bond demand
Interest rates fall - because the FED is such a willing lender, the banks can pay lower interest rates
By manipulating interest rates to artificially low levels, the FED never allowed the U.S. to recover organically from the 2008 market crash. The FED essentially propped up American businesses with free money, so the true market rate of interest could not be found. It has done this over and over again from 2008 to 2022. In March of 2020, for example, the FED increased its asset purchases by $1.50 trillion and then added another $500 billion four days later.
The good part about QE is that it allows the economy to grow and expand to levels it otherwise couldn’t, much like an athlete taking anabolic steroids. However, the downside is that inflation will eventually run rampant because people have too much money to spend. The FED had historically navigated the inflation issue well and kept it stable from 2008-2021. But it’s very tenable that the downstream effects of Covid lockdowns were the straw that broke the camel’s back.
Now, in 2022, the FED has removed its support of the QE program to thwart inflation. It is instead selling government bonds back to banks, a process called quantitative tightening (QT). In QT, interest rates rise because the FED is flooding the market with a newfound demand for dollars. QT increases interest rates and simultaneously pulls money out of the system. The idea here is that by increasing interest rates via QT, stock markets will crash, home prices will fall, and eventually people will stop spending money; inflation should decrease as a corrolary.
During QT:
The FED is borrowing from the economy - this is dampening
Stock prices fall - because businesses can’t grow as quickly when money is in short supply
Bond prices fall - because the FED is selling off the government bonds it previously purchased
Interest rates rise - because the FED is such a willing borrower, the banks can charge higher interest rates
What about Inflation?
The strange part about all this, again, is that expansions should bring about rising inflation, which should naturally bring about higher interest rates until, at some point, the contractionary cycle should begin. But because the FED has been laying on the economic gas pedal in the form of QE for so long, interest and inflation rates are rising in the face of the 2022 economic slowdown, which creates an even more harmful contraction.
It’s worthy to note that this contractionary cycle was inevitable; it was a always a question of “when” not “if.”
Think of the economy like a pendulum. If you swing too far in the direction of QE, the pain of QT is going to feel even worse.
What Next?
It’s very likely that America is in for a bit more economic trouble over these next couple of years as QT runs its course. But trying to guess what the FED will do next is a fool’s errand; therefore, it’s still a good idea to stay long-term oriented with your financial plans and investment portfolio.
At some unknown point, the process of QE will likely begin again, creating another spectacular growth period in America. Or, perhaps the Federal Reserve Board will learn its lesson and retire the QE program altogether, letting the free market decide the appropriate interest rates to pay.
Only the future will tell, and it’s very uncertain.